Improving Capacitance Estimation Accuracy: Accounting for Fringing Fields
- Avi Cohen

- 30 במרץ 2025
- זמן קריאה 6 דקות
Abstract
Parallel plate capacitors are fundamental elements widely employed in electrical and electronic engineering, significantly influencing PCB design, power integrity, and electromagnetic compatibility (EMC/EMI). While the classical capacitance formula is commonly used for quick estimations, it inherently assumes an ideal uniform electric field between infinite parallel plates. However, real-world capacitors exhibit fringing fields, causing deviations from theoretical calculations, especially noticeable when plate separation is not negligible relative to plate dimensions. This study systematically investigates these deviations for square-plate capacitors through rigorous 3D electromagnetic simulations utilizing CST’s RLC Solver. Multiple configurations with varying square-plate dimensions and separations were analyzed to quantify errors introduced by fringing effects. The findings provide practical correction factors, significantly improving capacitance estimation accuracy without requiring complex simulations.
Introduction
2.1 The Importance of Accurate Parallel Plate Capacitance Estimations
Parallel plate capacitance is pivotal in numerous engineering applications:
· Estimating common-mode impedance for PCB configurations.
· Ensuring effective ESD protection through accurate capacitance evaluation between PCB ground planes and conductive enclosures.
· Designing shielding enclosures by considering parasitic capacitances impacting EMI.
· Developing PCB stack-ups where unintended capacitances between reference layers influence signal integrity and power distribution.
Though engineers frequently use the classical capacitance formula due to simplicity, accuracy diminishes significantly as plate separations increase relative to plate dimensions. Fringing fields extend beyond the physical boundary of the plates, introducing additional capacitance unaccounted for in simplified calculations.
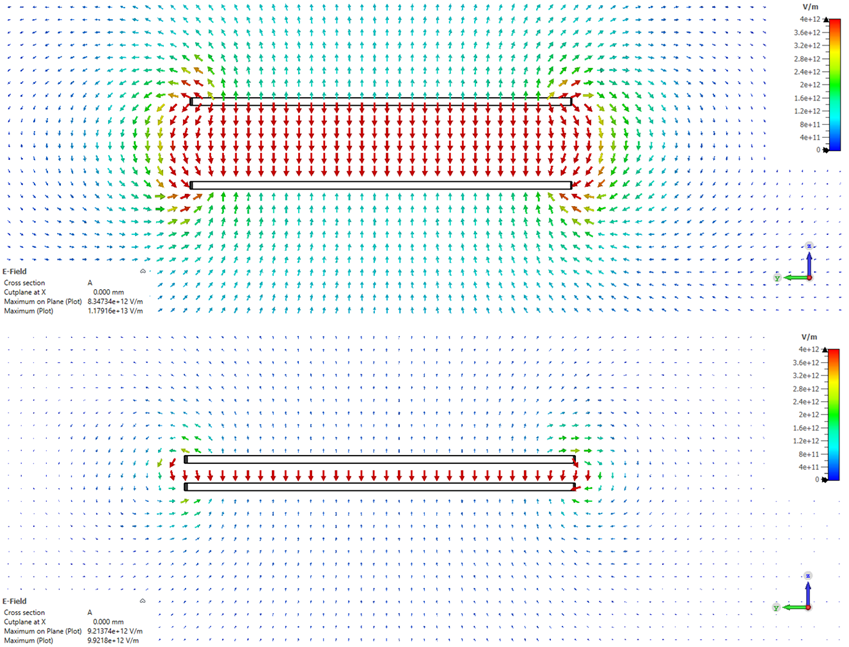
2.2 Objective of the Study
The purpose of this research is to:
Quantify discrepancies between theoretical capacitance predictions and realistic capacitance values obtained via 3D simulations.
Analyze how fringing field effects vary with geometric aspect ratios (square-plate side length-to-separation ratios, ).
Develop practical, empirical correction factors applicable for quick and accurate estimations.
Demonstrate clear practical implications of these corrections in engineering design practices.
3. Simulation Methodology and Results
3.1 Simulation Setup
The analysis used CST’s RLC Solver, known for precise electrostatic modeling, to simulate parallel plate capacitors with square-plate geometries (side lengths 10 mm, 50 mm, and 100 mm) and separations ranging from 1 mm to 50 mm. Simulation accuracy was ensured by fine meshing and boundary condition validations.
Note: Simulations in sections 3.1 through 3.6 were performed assuming air as the dielectric medium
3.2 Deviations Between Theory and Simulation
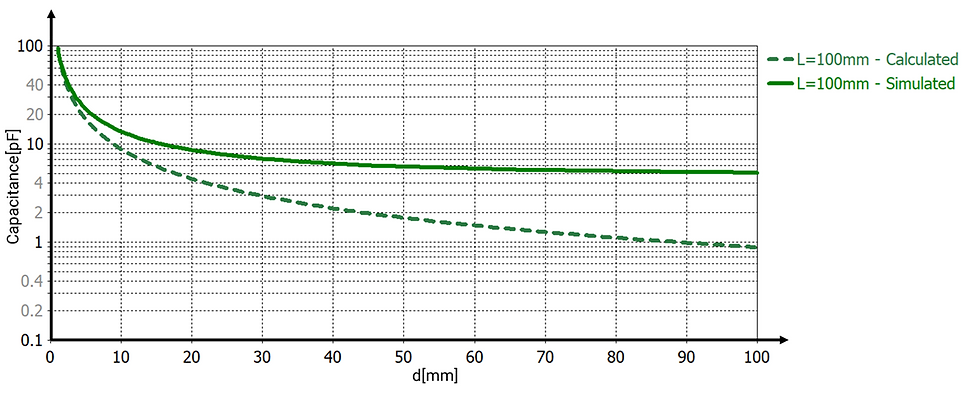
Initial simulations compared theoretical capacitance with simulated results for a baseline capacitor (100 mm square plate), systematically varying plate separation. Results revealed significant deviations from classical calculations at smaller aspect ratios.
3.3 Analysis of Relative Error
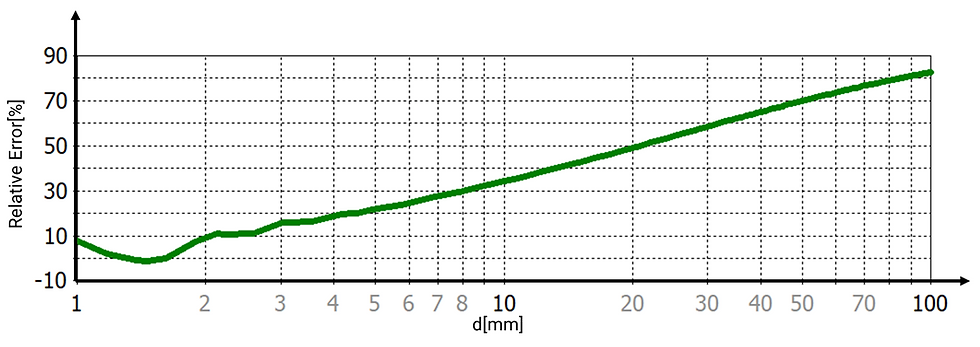
Further analysis focused on relative error, defined as

Figure 3 displays relative error trends clearly demonstrating a nonlinear increase as plate separation increases for a 100 mm square-plate capacitor.
3.4 Relative Error Versus Aspect Ratio
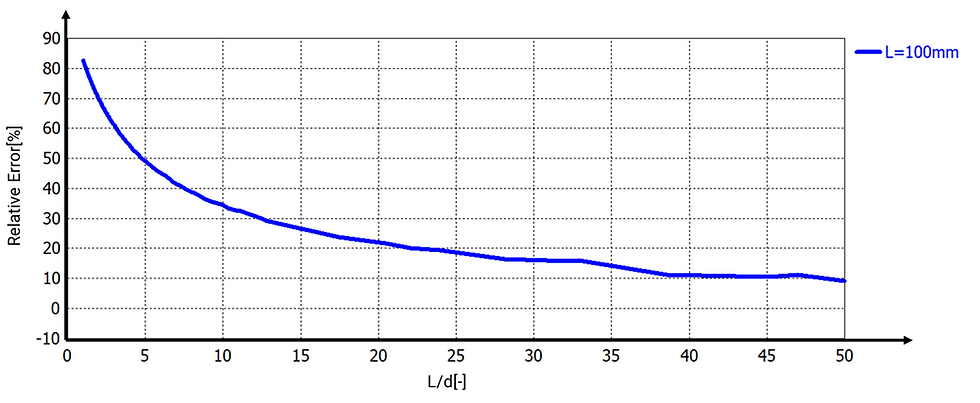
The analysis was extended to examine the relative error between theoretical and simulated capacitance values as a function of the aspect ratio (L/d).
As shown in Figure 4, the relative error increases significantly when L/d is below 20, reaching values above 40% for L/d ≈ 5, and exceeding 75% for L/d ≈ 1.
These findings highlight the growing influence of fringing fields at low aspect ratios, reinforcing the need for correction factors in such cases
3.5 Consistency Across Multiple Square-Plate Sizes
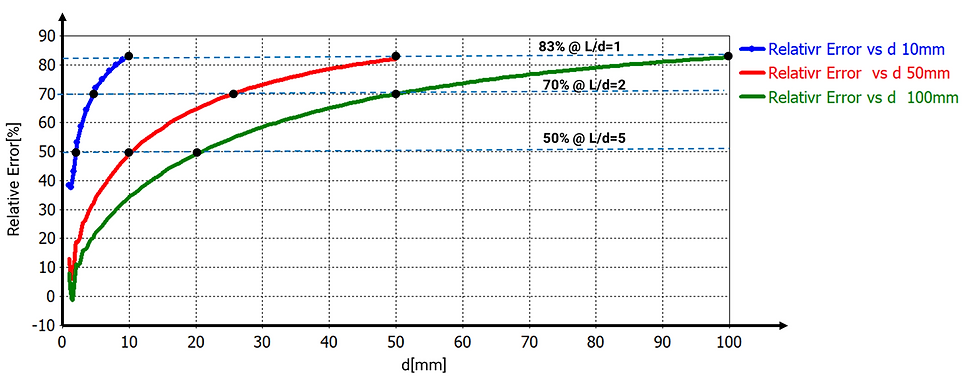
To ensure general applicability, simulations were replicated for additional square-plate sizes (L=10 mm, 50 mm, and 100 mm side lengths). Results (Figure 5) confirmed consistent error patterns across varying plate dimensions, emphasizing that deviations depend exclusively on aspect ratios rather than absolute size.
3.6 Development of Practical Correction Factors
From these insights, practical correction factors were derived, providing engineers an empirical yet accurate adjustment method:
Correction Factor [*] | Maximum Relative Error | Aspect ratio [L/d] |
5.56 | 82% | 2>L/d |
2.86 | 65% | 5>L/d>2 |
1.82 | 45% | 10>L/d>2 |
1.43 | 30% | 20>L/d>10 |
1.25 | 20% | 40>L/d>20 |
1.11 | 10% | 40<L/d |
3.7 Extended Analysis: Microstrip Configuration with FR-4 Dielectric
To further explore practical scenarios relevant to PCB engineering, additional simulations were performed using capacitors configured in a microstrip-like structure. In typical PCB designs, the microstrip configuration consists of a conductor placed above a larger reference layer (ground plane), with a dielectric material separating them. For these simulations, the dielectric chosen was FR-4, a standard PCB substrate with εr ≈ 4.3
The analysis considered three microstrip capacitors with the top conductor dimensions of L=100 mm, 50 mm, and 10 mm, respectively. Each configuration had a reference (ground) layer with dimensions ten times greater than those of the top conductor, ensuring minimal edge effects on the reference layer side. Plate separations were varied systematically to investigate the fringing field effects clearly.
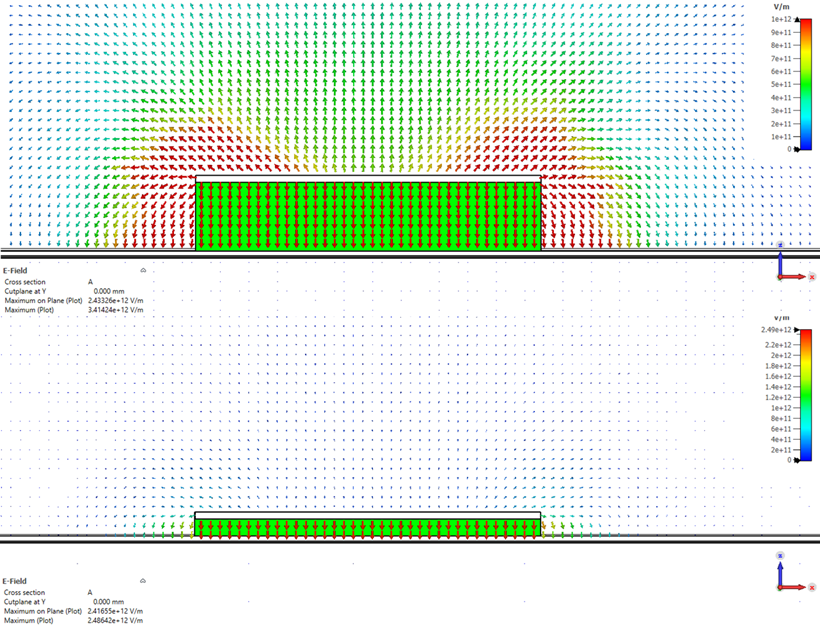
The simulations compared capacitance values obtained using CST’s RLC solver with theoretical capacitances calculated using the classical parallel plate formula adjusted for the FR-4 dielectric. The relative errors from these simulations were analyzed and compared to previous air-filled parallel plate capacitor results.
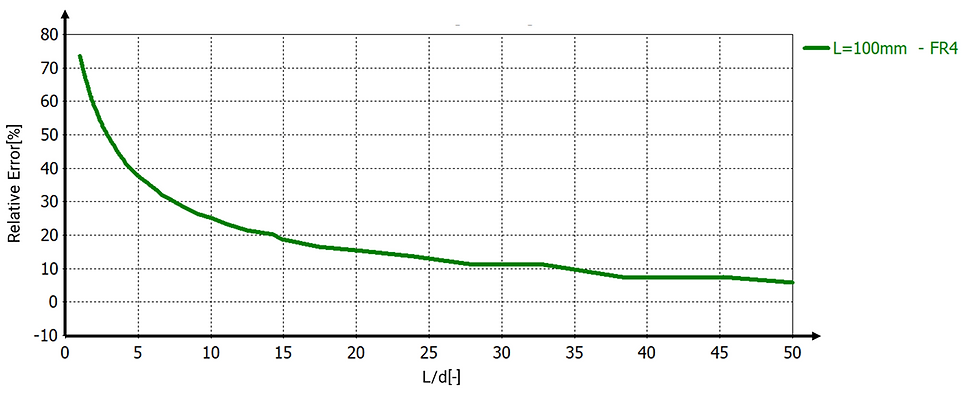
A comparative analysis of relative errors between the air-filled capacitor configurations (previously presented) and the current microstrip scenario (with FR-4 dielectric) revealed noticeable differences. The presence of FR-4, characterized by a significantly higher dielectric constant (4.3), altered the electric field distribution and influenced the degree of relative error significantly.
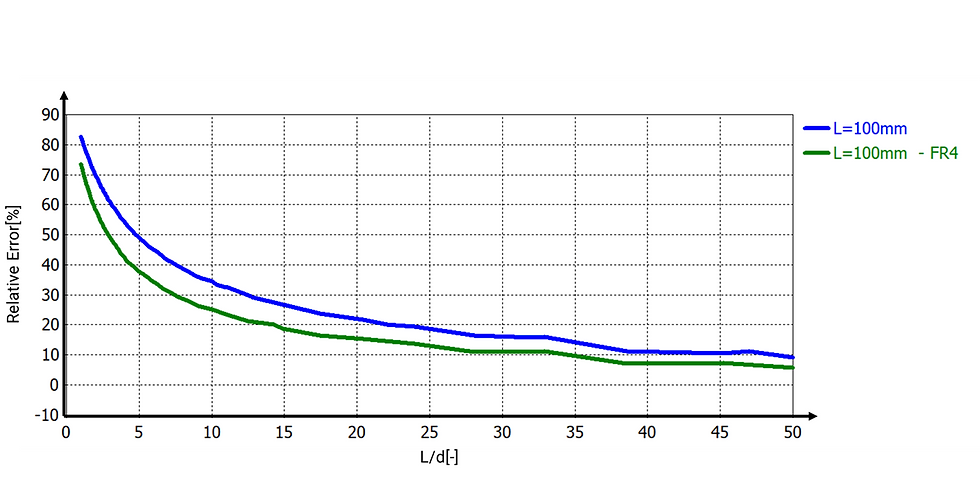
Figure 8 compares the relative error between the classical formula and simulated values for air and FR4. While both materials follow a similar error trend across aspect ratios, the relative error is consistently higher when the dielectric is air. This is because air, with a low permittivity, allows electric field lines to fringe more significantly beyond the plate edges. In contrast, FR4 confines the electric field more tightly, resulting in lower fringing contribution and smaller error. Therefore, when using the classical formula, one should expect greater deviations in low-permittivity environments.
Correction Factor [*] | Maximum Relative Error | Aspect ratio [L/d] |
4 | 75% | 2>L/d |
2.22 | 55% | 5>L/d>2 |
1.6 | 38% | 10>L/d>2 |
1.35 | 26% | 20>L/d>10 |
1.2 | 17% | 40>L/d>20 |
1.1 | 9% | 40<L/d |
Table 1- Correction Factors for Square-Plate Capacitance with FR4 dielectric Estimation
Practical Design Guidelines
4.1 Application Examples
Consider a PCB design scenario where accurate capacitance estimation between a PCB and enclosure is critical for EMI control. Utilizing traditional equations alone could underestimate capacitance significantly, potentially compromising EMI performance. Applying the derived correction factors ensures improved EMI mitigation strategies, yielding more reliable designs.
Similarly, for high-frequency PCB stack-ups, accurately assessing interplane capacitance enhances signal integrity modeling, and minimizing unwanted resonances, and impedances.
4.2 Comparison of Correction Factors for Air and FR4 Dielectrics
To further understand the influence of the dielectric medium on fringing field effects, we compared the correction factors derived for two different scenarios:
Capacitors with air as the dielectric medium
Capacitors with FR4 substrate (εr ≈ 4.3)
Both scenarios use the same plate size L=100 mm, and correction factors were extracted for various values of the ratio L/d. The results are summarized in the table below:
Correction Factor (Fr4) | Correction Factor (Air) | Aspect ratio[L/d] |
4 | 5.56 | 2>L/d |
2.22 | 2.86 | 5>L/d>2 |
1.6 | 1.82 | 10>L/d>2 |
1.35 | 1.43 | 20>L/d>10 |
1.2 | 1.25 | 40>L/d>20 |
1.1 | 1.11 | 40<L/d |
Table 2- Correction Factors for Air vs. FR4 Dielectric
4.3 Observations and Insights:
· Always assess the aspect ratio L/d when estimating parallel plate capacitance.
· For L/d<20, fringing fields cause substantial deviation from the classical formula, and correction is necessary.
· Use the provided correction factors — based on material and aspect ratio — to improve estimation accuracy.
· Air-based corrections offer a conservative upper bound; FR4-specific factors are more accurate for PCB-related applications.
· For critical designs, validate one representative geometry using simulation, then apply empirical factors across similar cases..
Conclusion
This study highlights the practical limitations of the classical parallel plate capacitance formula, particularly in cases where the aspect ratio L/d is small — that is, when the distance between plates is not negligible compared to their size. In such scenarios, fringing fields become dominant and introduce significant deviation from theoretical estimates.
Key takeaways:
· The relative error depends primarily on the aspect ratio L/d, rather than on the absolute dimensions of the plates.
· Simulation-based correction factors significantly improve estimation accuracy and are consistent across different plate sizes.
· Fringing effects are more pronounced in air than in FR4, but both materials follow similar trends. This allows for straightforward calibration based on dielectric type.
· The provided tables enable engineers to make quick and accurate adjustments to classical calculations without the need for full 3D electromagnetic simulations.
By applying these insights, engineers can obtain more realistic capacitance values, avoid underestimation, and improve the accuracy of design decisions in PCB stackups, shielding enclosures, ESD setups, and common-mode impedance estimations.
תגובות